Proactive Postgres Monitoring: From Insight to Action
Don't wait for customers to report slow service or for downtime to strike. My custom monitoring setups provide the visibility to identify performance bottlenecks, predict resource needs, and ensure your database is reliable and fast.
The Challenge: Seeing the Full Picture
Standard system monitoring tools track system-level metrics like CPU, memory and io throughput but miss the fine-grained details inside your database.
Postgres's own pg_stat_* views offer a real-time snapshot, but they don't reveal performance trends or long-term dynamics crucial for strategic planning and optimization. Without a comprehensive, historical view, you're often left guessing.
The Solution: A Tailor-Made Monitoring Stack
I deliver monitoring setups using a powerful, customizable, and open-source stack. The core is pgwatch, a flexible monitoring daemon that gathers detailed metrics from multiple databases and related components (like PgBouncer). This data is stored in a time-series database and visualized in Grafana.
Key Benefits:
- Intuitive Visualization: Get intuitive Grafana dashboards tailored to your needs, from high-level health checks to deep-dive query analysis.
- Empower Your Team: Provide developers and architects with the data they need to build better, more efficient applications.
- Custom Metrics: Easily integrate application-specific metrics and alerting.
- Automated & Repeatable: The entire monitoring setup can be provisioned as Infrastructure-as-Code (IaC) using Ansible, ensuring versioned configuration, consistency and reliability.
Example Dashboards
Get an impression of the clarity and insight a custom monitoring setup can provide. These are just a starting point—your dashboards will be tailored to your specific requirements.
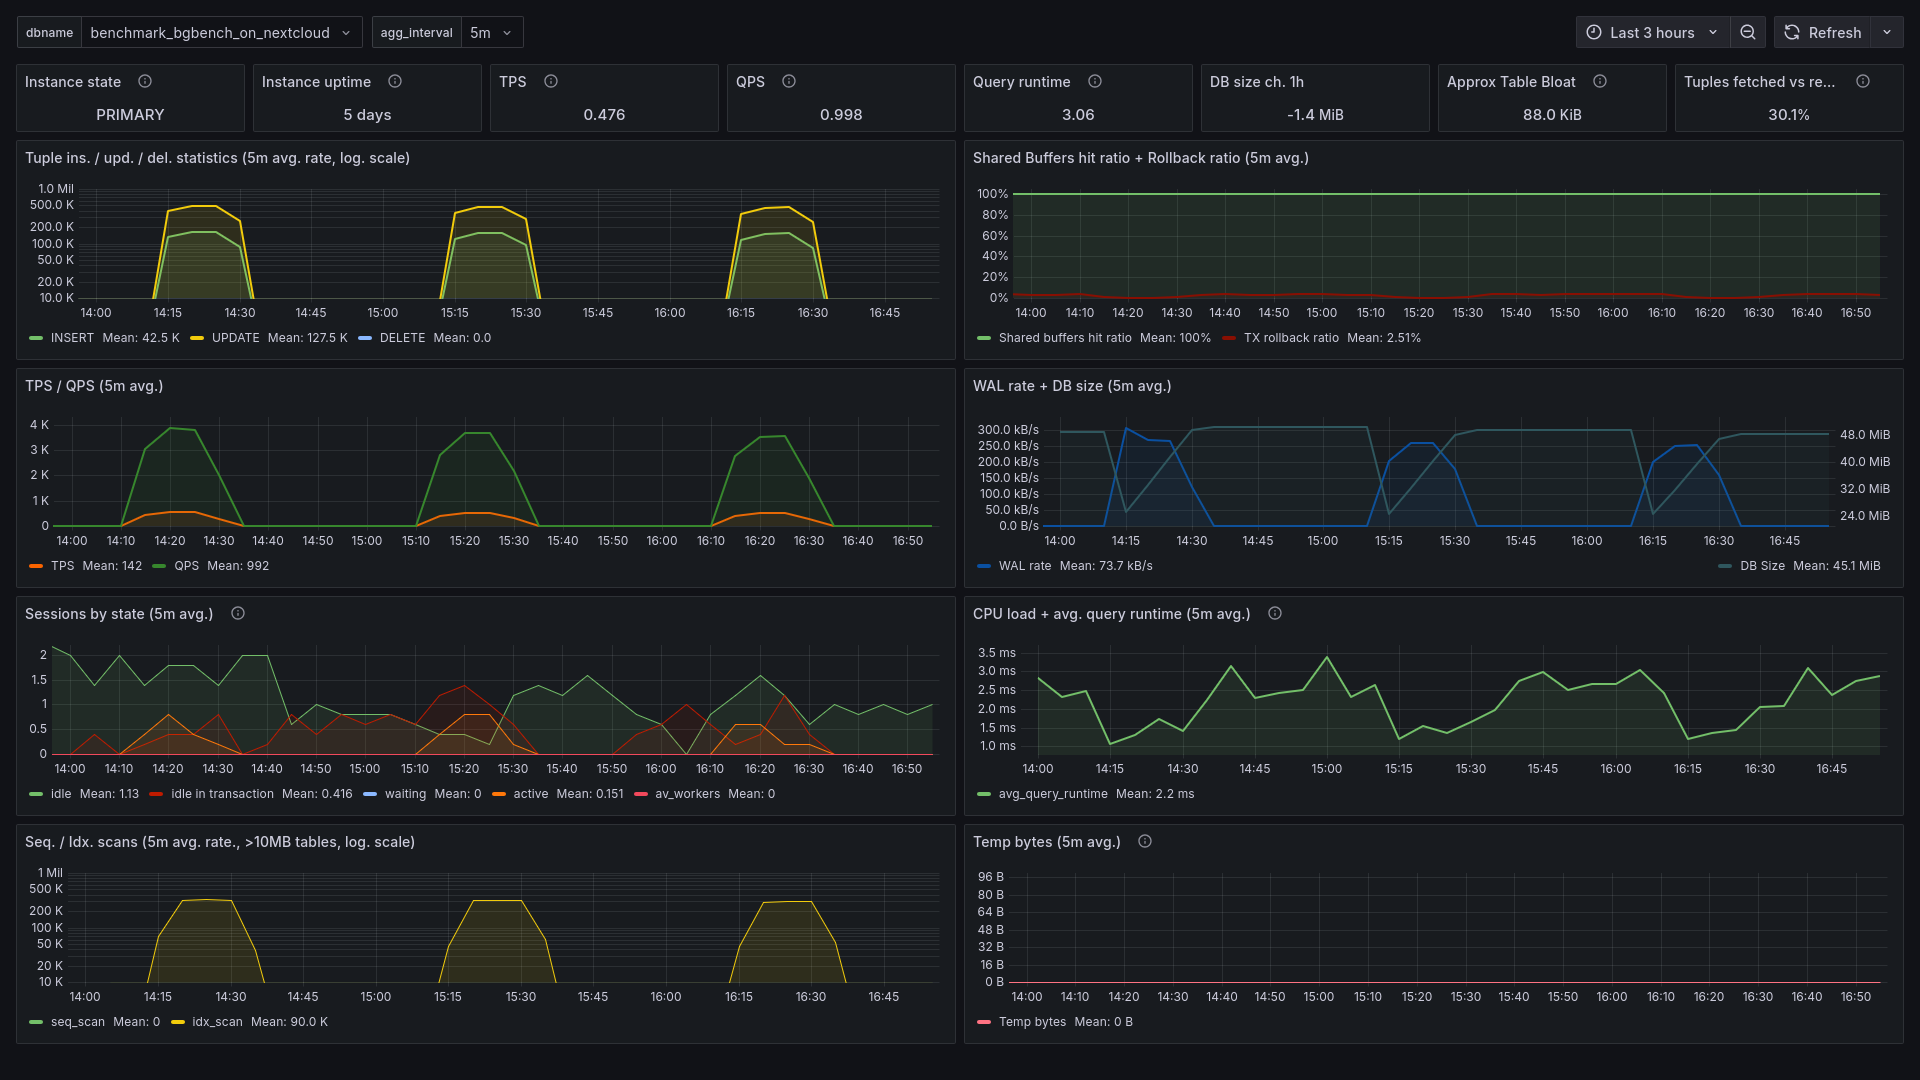
Database Overview
At a glance, see basic database performance KPIs, resource utilization, and overall system health.
Query Performance Deep-Dive
Pinpoint the exact queries causing slowdowns, identify locking issues, and analyze execution plans to find optimization opportunities.
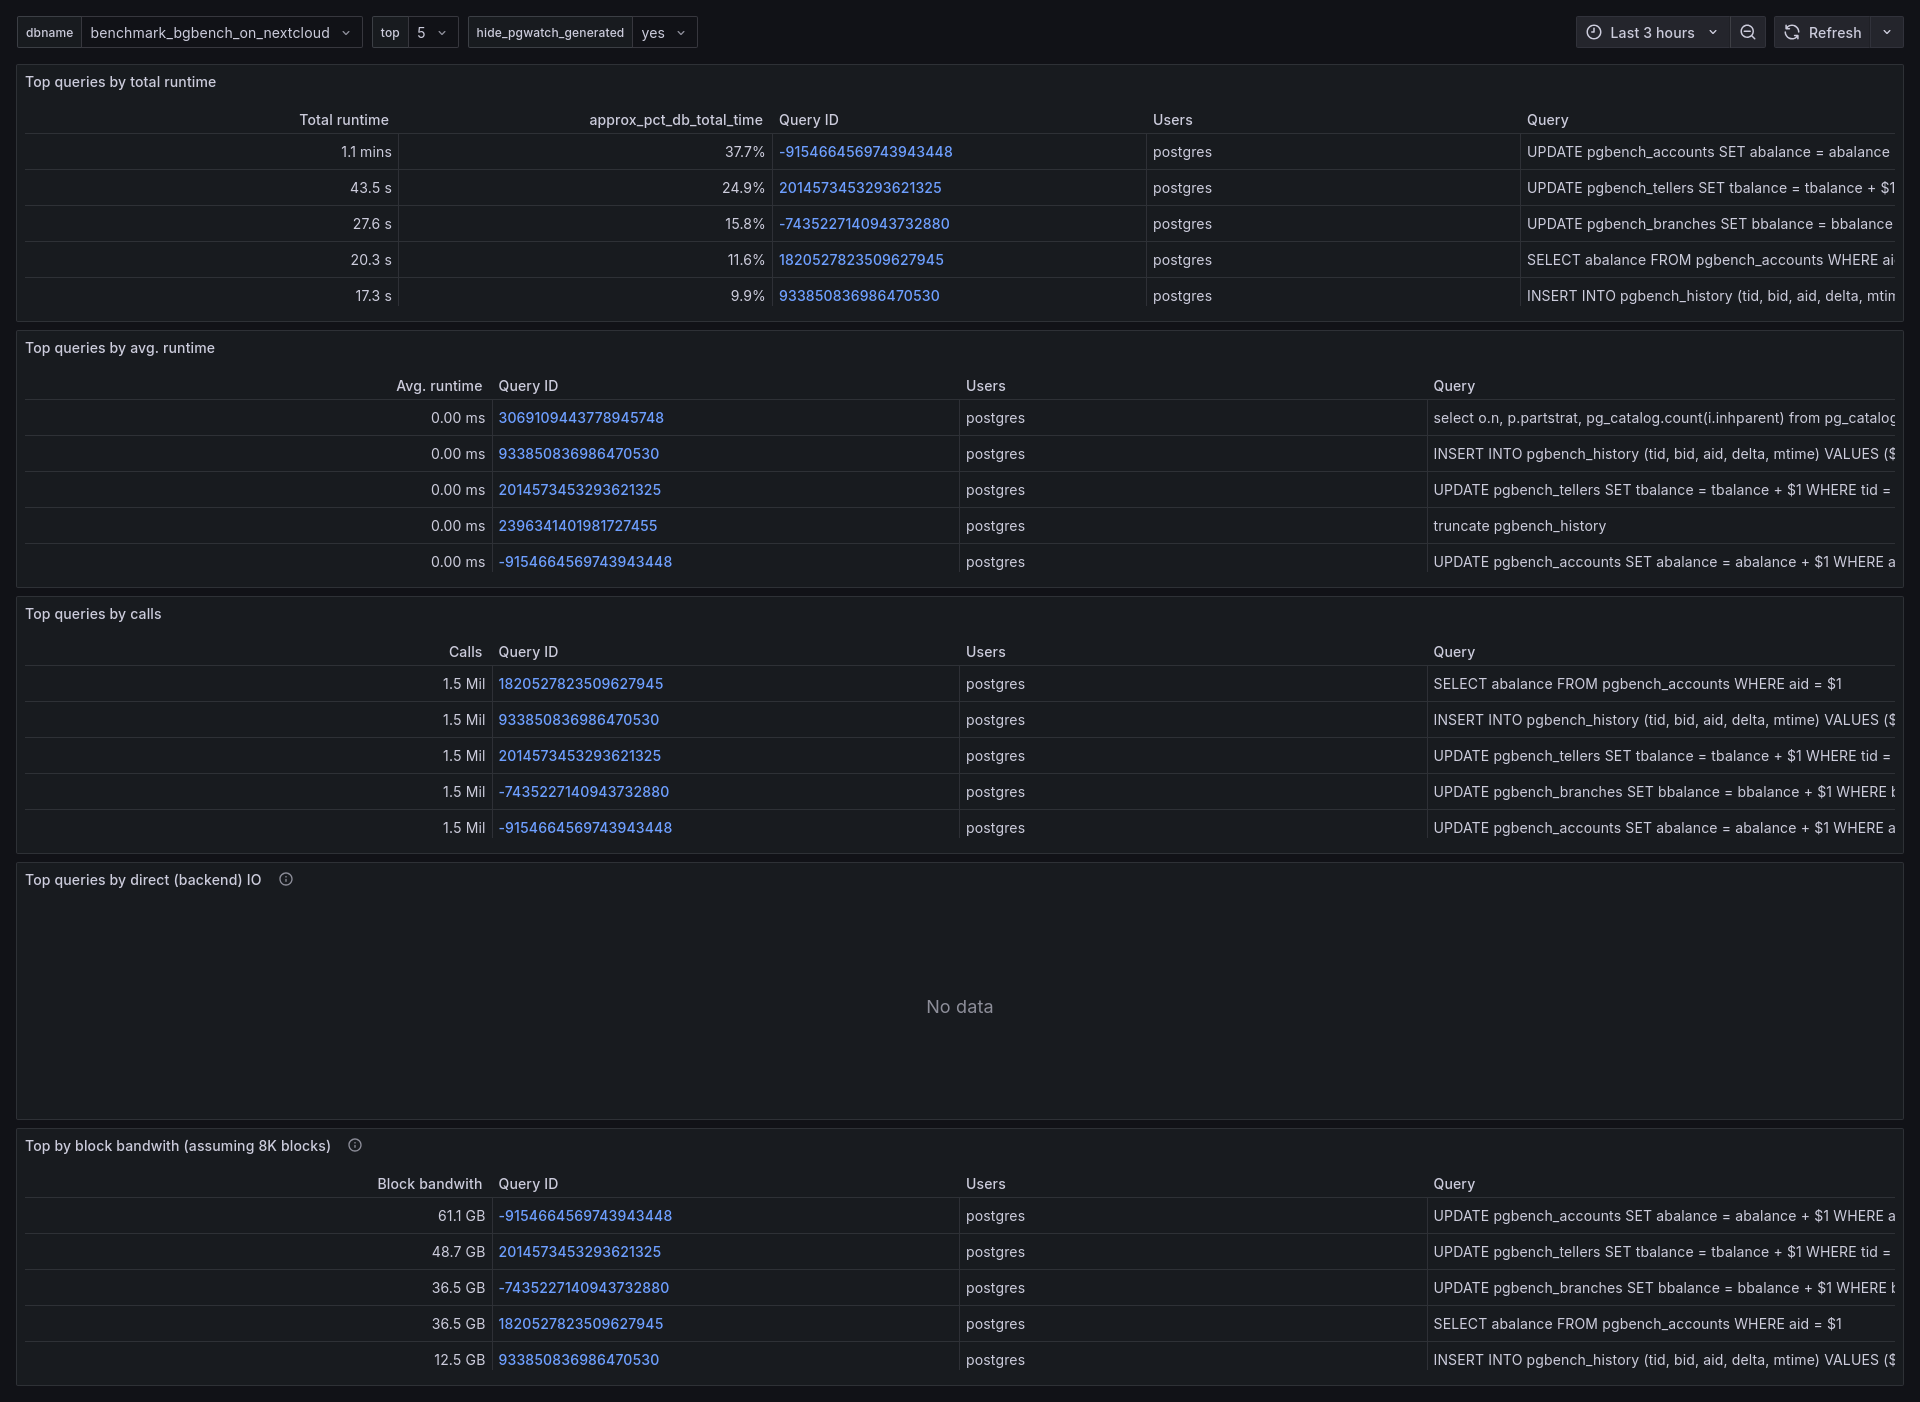
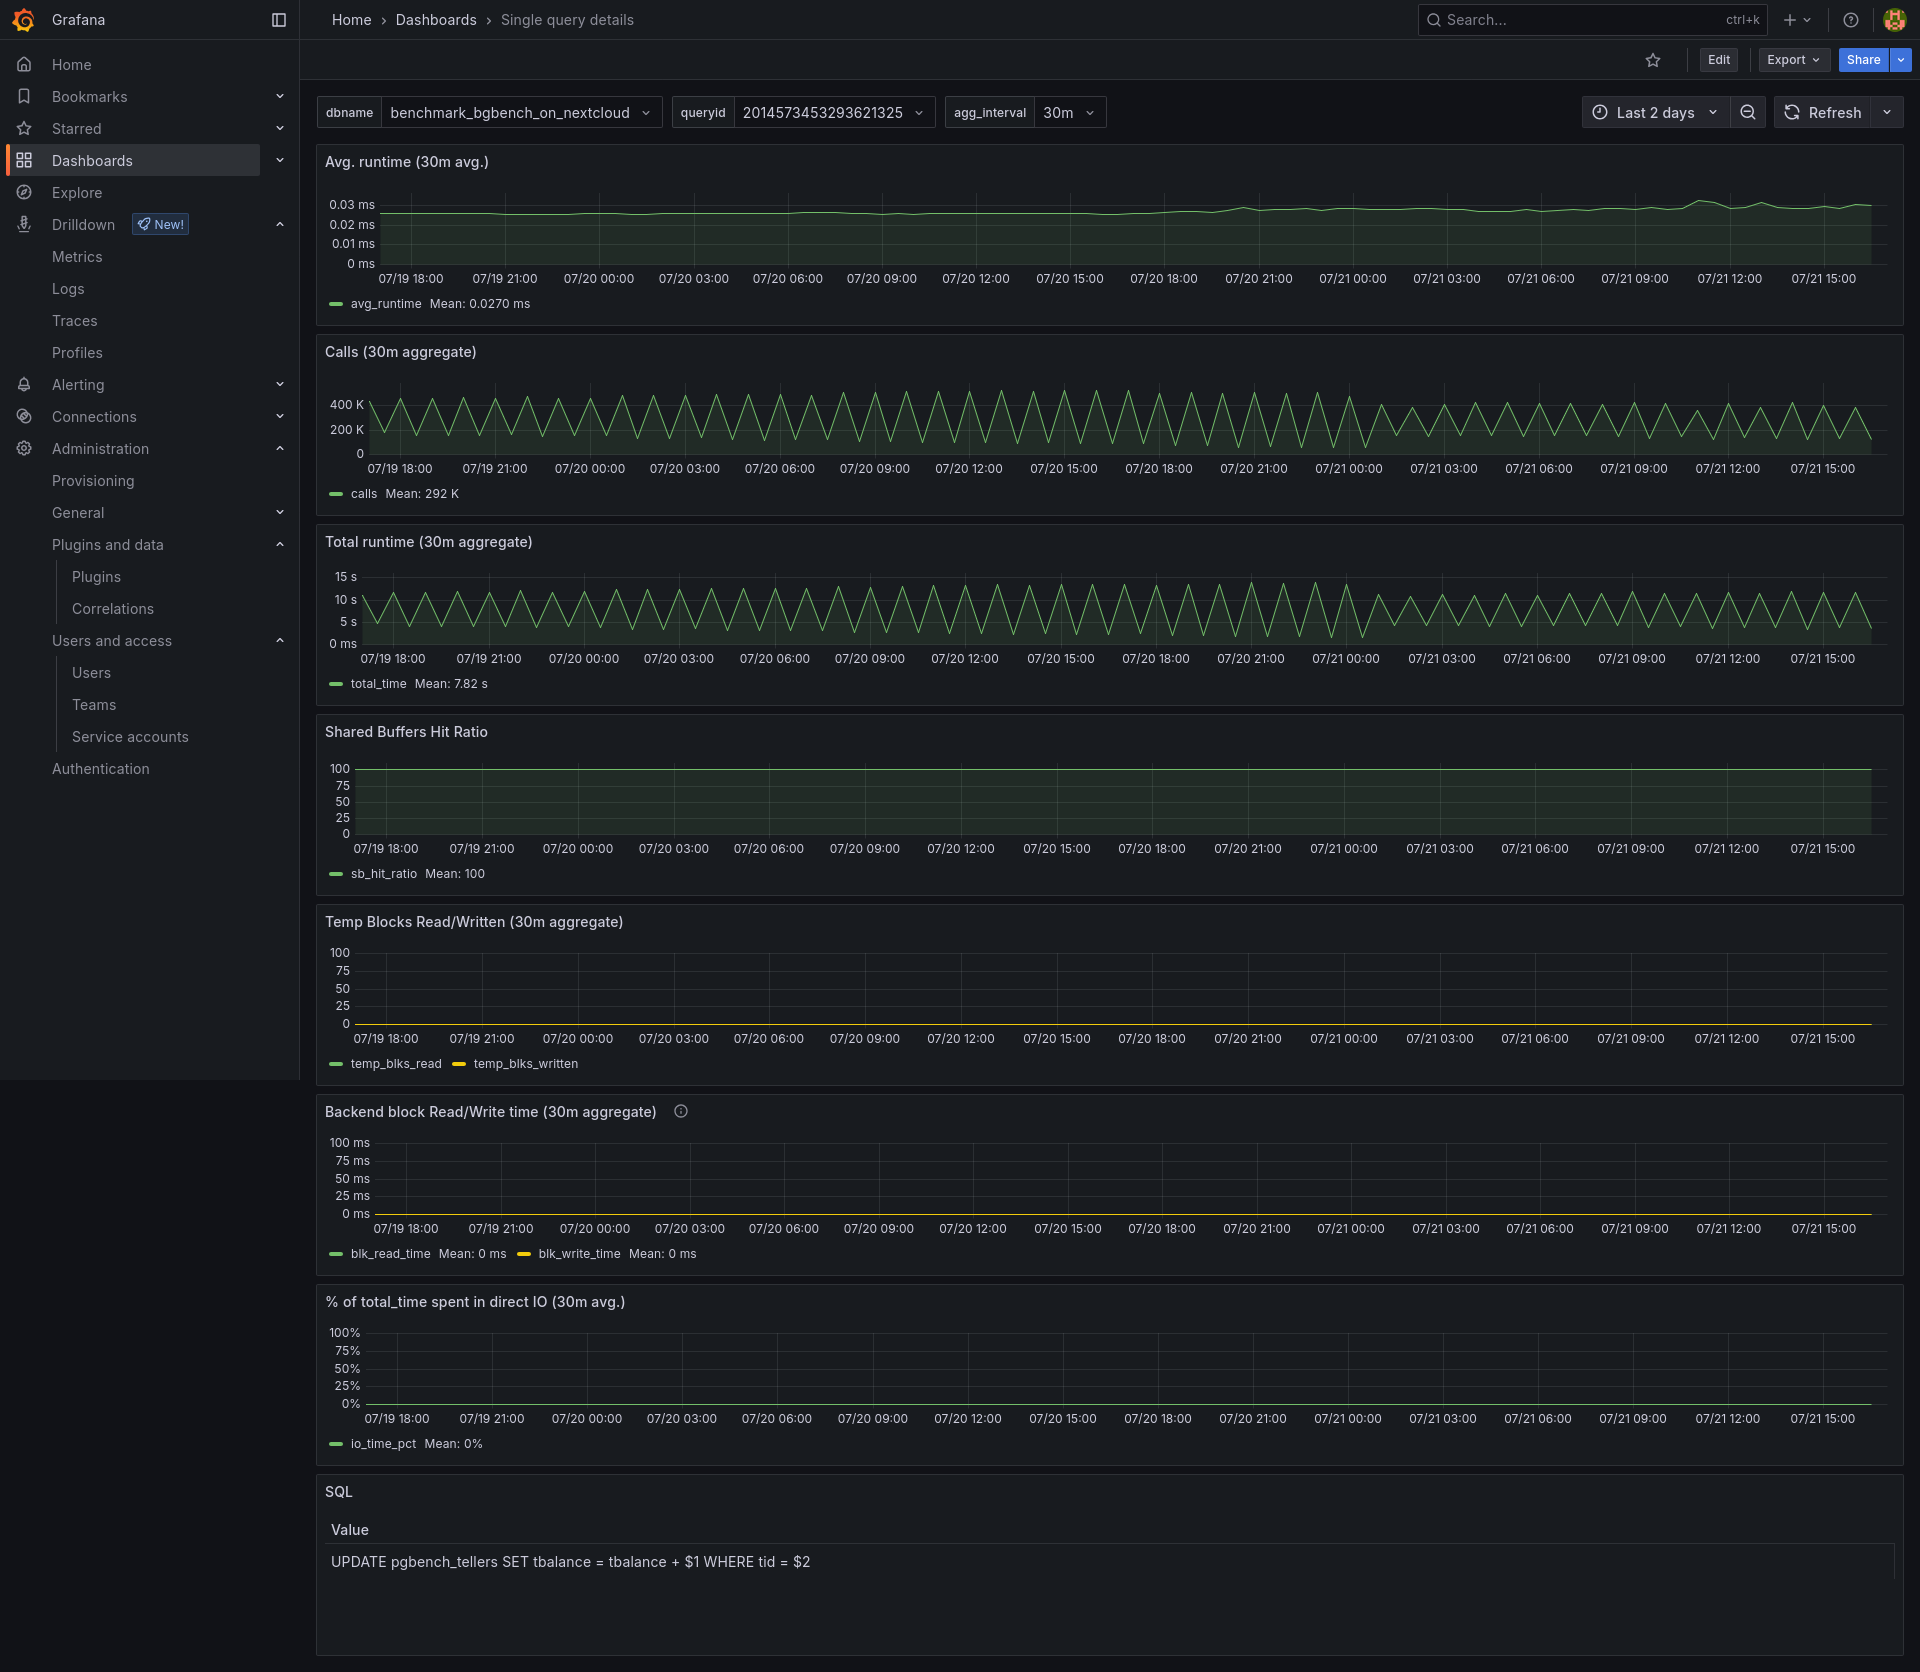
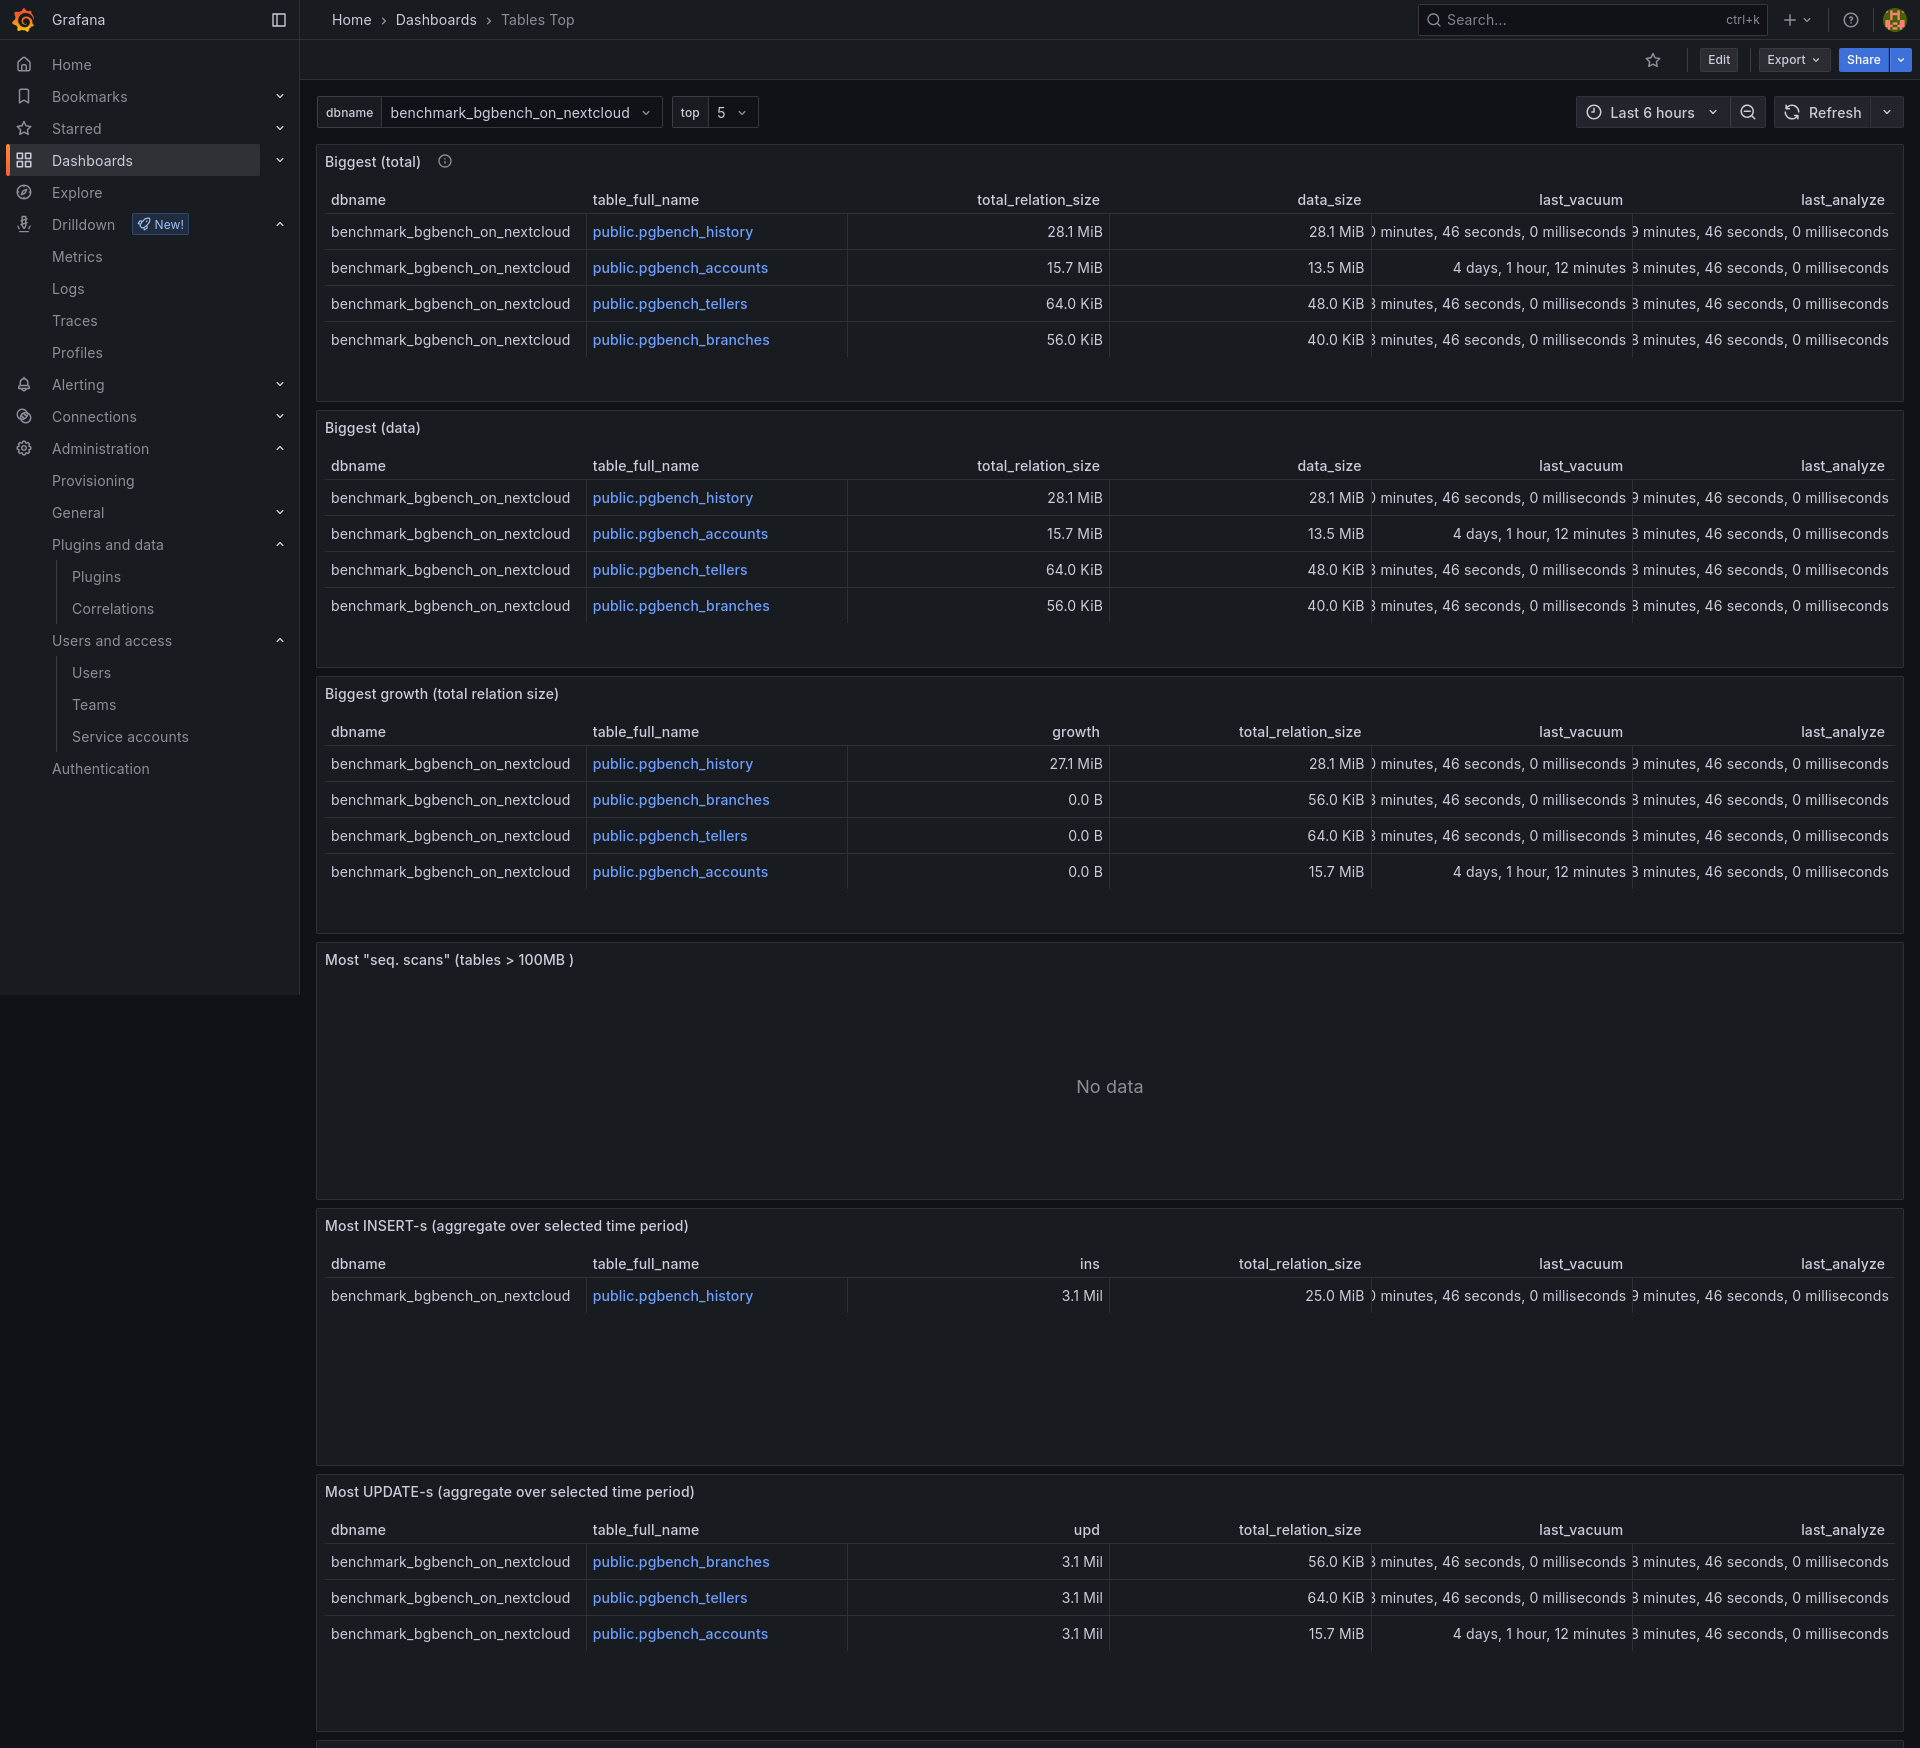
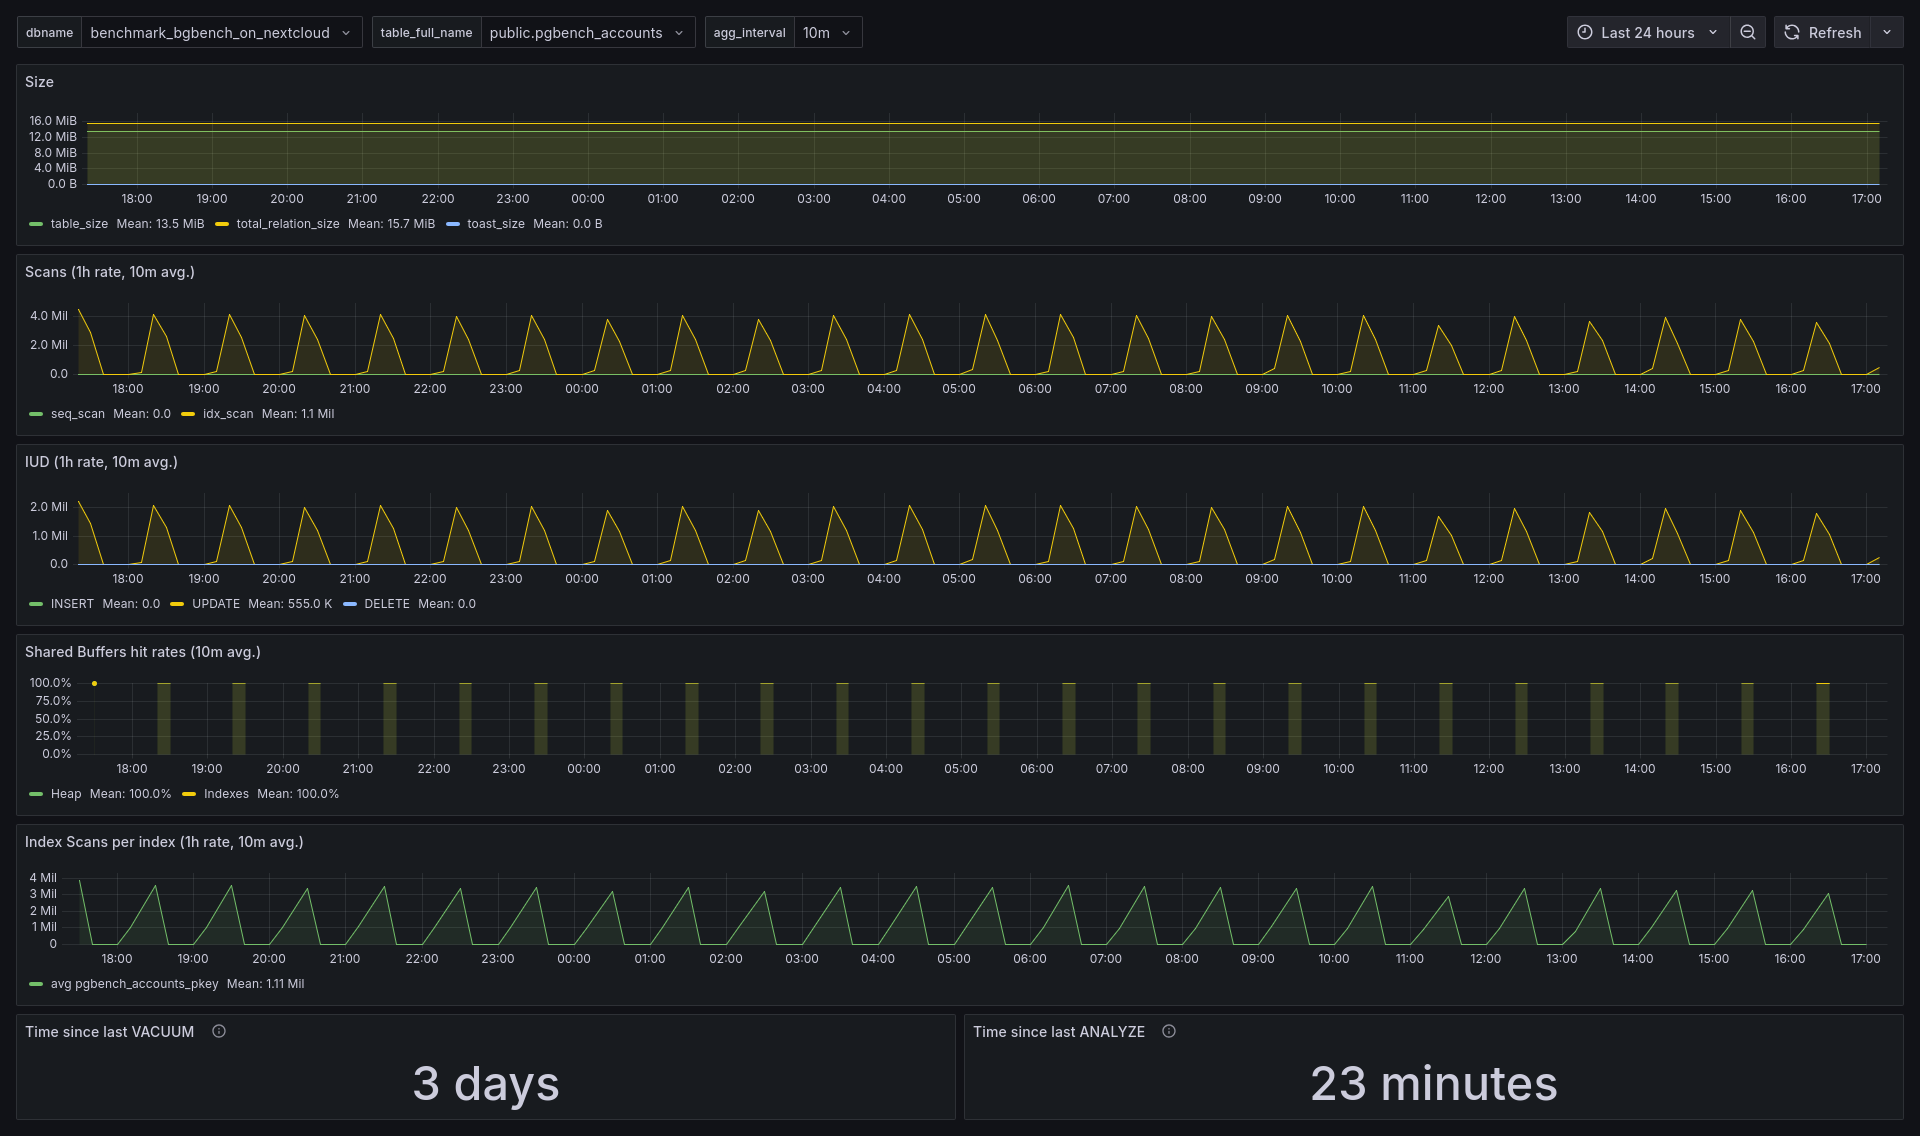
Table Optimization Deep-Dive
Analyze table size, bloat, vaccuum optimization and index efficiency to keep your database lean and fast.
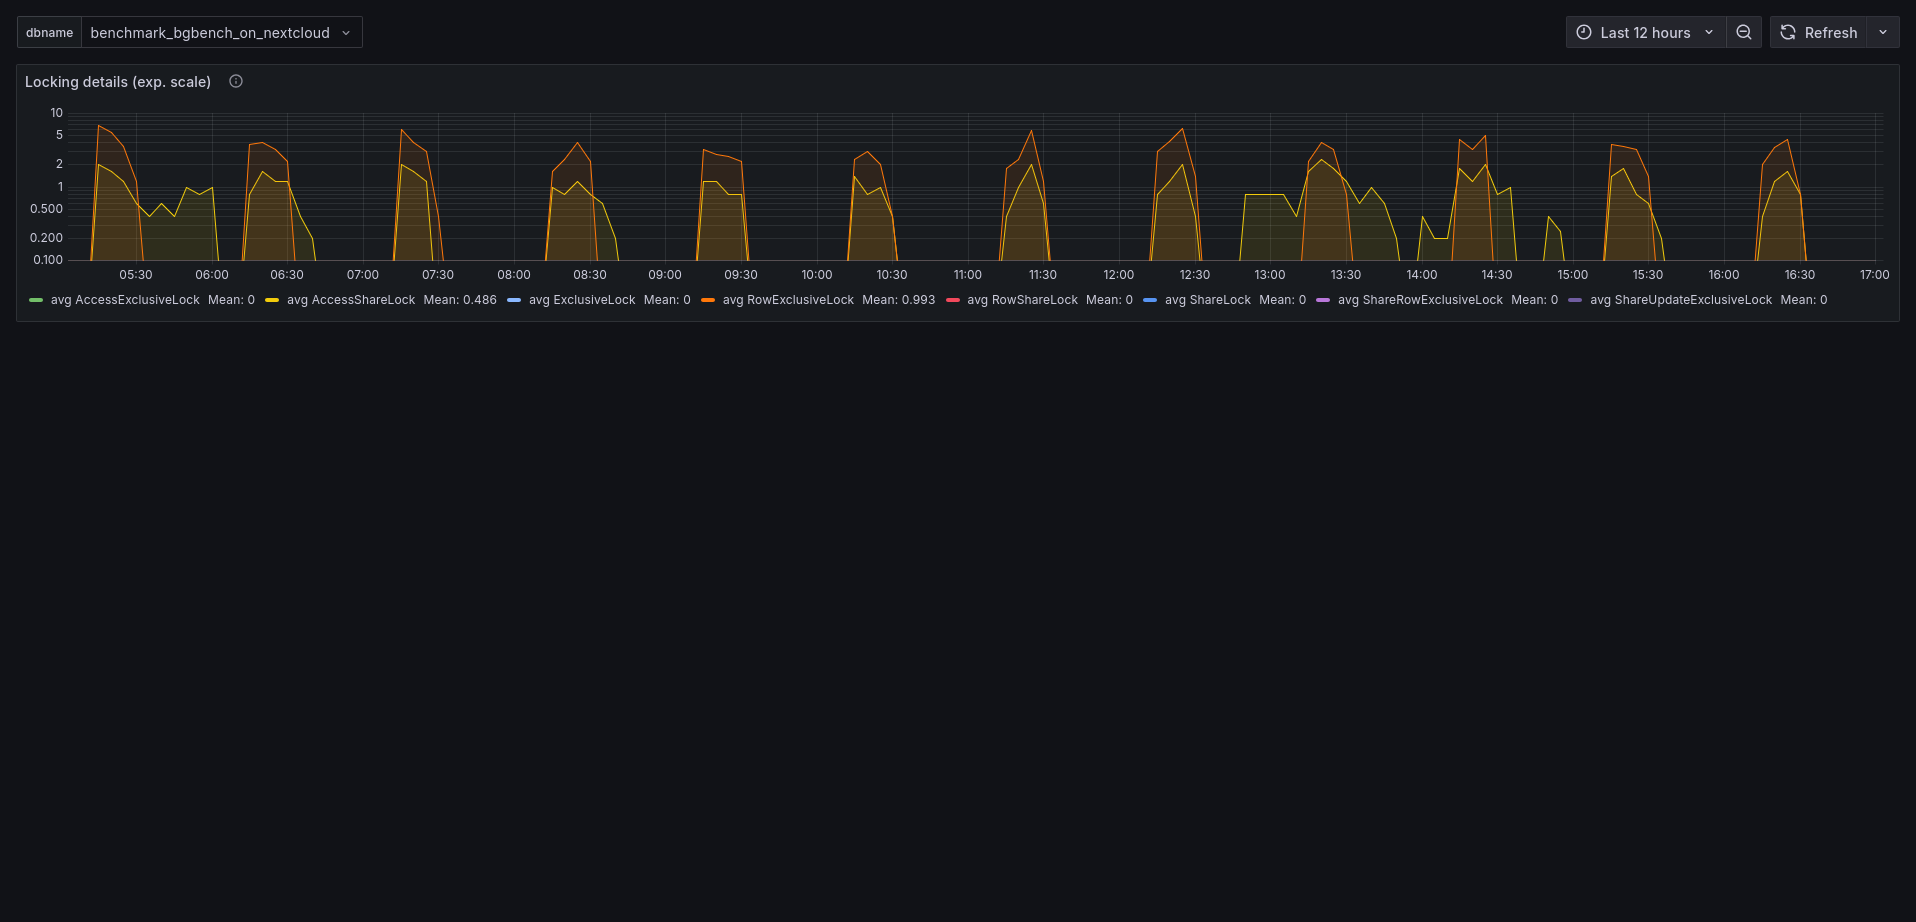
Lock Analysis
Visualize lock contention to diagnose and resolve concurrency bottlenecks.